Written by 0xWeilan @ eMerge IS
This week, both the US September CPI and PPI exceeded expectations, and international energy supply shocks and persistently high interest rates once again became the main pricing drivers in financial markets. Meanwhile, revenue growth, capital expenditure, and credit risk in the AI industry chain came under scrutiny, leading to a shift from previously strong risk-on trading to risk-off trading. Funds were reallocated across assets and sectors: US Treasuries and the Dow Jones Industrial Average rose, while the Nasdaq, gold, and BTC fell.
Macro Finance
The ongoing conflict in the Middle East continues to disrupt energy transport expectations around the Strait of Hormuz. Brent crude oil closed at $109.86 per barrel on October 16, up about 4.9% for the week. If supply risks persist, high energy prices will increase the difficulty for US inflation to fall through fuel, transportation, and raw material costs.
September's CPI rose 3.7% year-on-year, higher than August's 3.4%, and 0.6% month-on-month; core CPI rose 2.6% year-on-year and 0.3% month-on-month. PPI rose 6.3% year-on-year and 1.3% month-on-month, marking the largest monthly increase since March 2022. Final demand for goods rose 2.6% month-on-month, service prices rose 0.8%, and transportation and warehousing services rose 3.4%. Energy was the main driver, but the PPI excluding food, energy, and trade services still rose 0.5% month-on-month, indicating some cost pressure in non-energy sectors.
The US economy has not yet shown a clear slowdown, but the quality of growth has been eroded. Retail sales rose 0.8% month-over-month in September, with core consumption, excluding factors such as gasoline, weak. Non-farm payrolls increased by only 29,000, the unemployment rate remained at 4.2%, and initial jobless claims this week totaled 199,000, indicating low hiring and low layoffs. With inflation rising but employment not yet deteriorating sharply, the Federal Reserve lacks the conditions to quickly shift to easing. The market is more inclined to pause rate hikes in October, but the risks of another rate hike this year and the prolonged maintenance of restrictive interest rates still need to be considered.
The divergence in US stocks reflects this constraint. This week, the Nasdaq Composite Index fell 4.48%, the S&P 500 fell 1.95%, while the Dow Jones Industrial Average rose 0.67%; the Philadelphia Semiconductor Index fell 11.41%, Nvidia fell 6.61%, and AMD and Micron Technology fell 13.05% and 14.59%, respectively. The correction was concentrated in the AI industry chain, which had previously been overvalued and had high capital expenditures, and the market is beginning to pay more attention to the match between revenue growth and investment returns.
On October 14th, reports indicated that Anthropic, preparing for its IPO, disclosed third-quarter revenue of approximately $16.8 billion, a 45% increase quarter-over-quarter, maintaining high growth, but significantly slower than the previous quarter, leading some investors to lower their valuation expectations. Meanwhile, CoreWeave, heavily reliant on debt financing for its AI infrastructure, reportedly has a debt burden of approximately $50 billion, with some bond yields rising to 15%-16%, and credit default swap spreads reaching approximately 1,200 basis points at one point, causing its stock price to fall by about 25% in a single week. The former highlights the risk of mismatch between the growth of end-user AI service revenue and high valuations, while the latter exposes issues with the sustainability of its financing structure and capital expenditures. These events have prompted the market to re-examine the AI industry chain, but are insufficient to confirm that the entire AI capital expenditure cycle has reversed.
More significant this week was the divergence between credit spreads and the risk-free rate: the yield on the 10-year US Treasury note fell from approximately 5.24% to 5.09%, the US dollar index dropped from 102.21 to 101.84, while the financing yields of some highly leveraged AI companies rose sharply. A decline in the risk-free rate does not necessarily equate to an improved corporate financing environment. When credit spreads widen more than the decline in Treasury yields, actual financing costs may still rise. Consequently, the market is shifting from simply trading on inflation and policy rates to reassessing corporate cash flow, debt repayment capacity, and return on capital.
Funds rotated from technology growth stocks to US Treasuries and some traditional and defensive sectors with stable cash flow and low valuations, contributing to the relative strength of the Dow Jones Industrial Average. Gold fell about 0.7% for the week, and Bitcoin fell about 1.85% for the week; however, since both had already undergone price adjustments, the declines this week were not significant.
Crypto Market
This week, BTC fell from approximately $82,912 to $81,378, a drop of 1.85%, with a weekly low near $79,700; the decline was less severe than the previous week's 2.16%. According to eMerge IS, the average daily spot trading volume decreased by approximately 1.6% week-over-week. The price decline and contraction in trading volume are consistent with insufficient new buying demand, but this does not support simply defining this week as a sustained sell-off with high volume. The price at the end of the period was below the 30-day moving average of approximately $83,543, but still above the 90-day moving average of approximately $75,134, indicating a weak short-term structure while the medium-term structure has not yet been fully broken.
The liquidity situation remains stagnant. Data from Farside Investors shows that US spot BTC ETFs saw a net outflow of approximately $228 million this week, a reduction of about 66% from the previous week's net outflow of $679 million. However, eMerge IS data shows that stablecoin supply still decreased by approximately $1.144 billion this week, roughly the same as the previous week.
On-chain tokens are still being redistributed. According to eMerge IS data, the supply from long-term holders (LTH) continued to decrease this week, while the supply from short-term holders (STH) increased. Exchange BTC balances grew for the second consecutive week, although the rate of LTH supply reduction and exchange accumulation both slowed. The shift of long-term tokens to more active groups and the increase in potential tradable inventory on exchanges are consistent with a weak spot market environment.
The realized profit/loss structure suggests that the market is primarily digesting existing profits rather than clearing out widespread losses. The 14-day moving average of the Realized Profit/Loss Ratio remains above 1, but has fallen from recent highs, meaning that total realized profits still exceed total realized losses, and the profit advantage is diminishing.
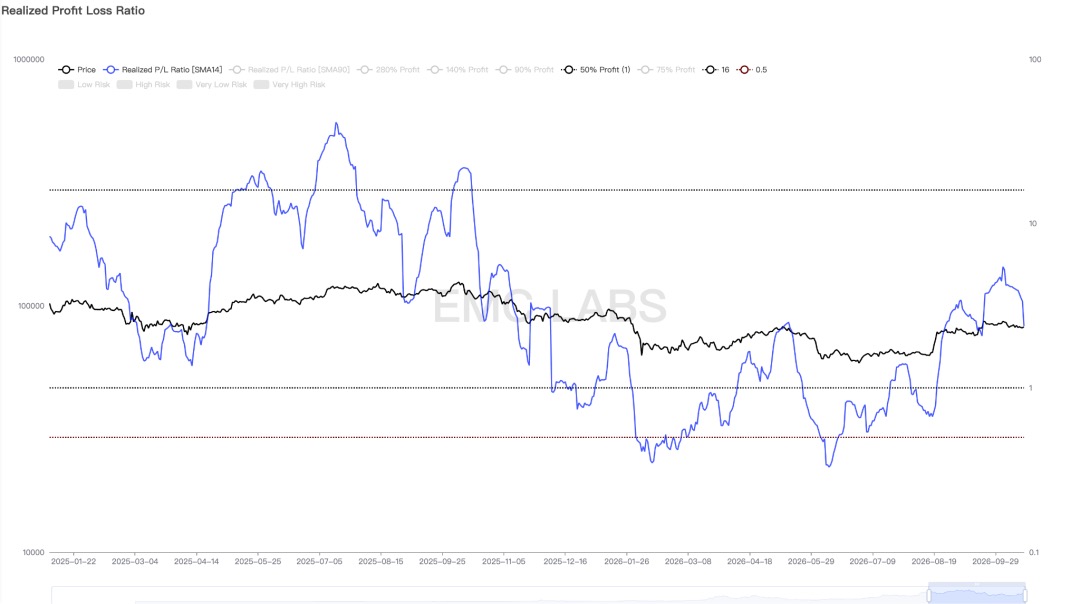
The Realized Profit/Loss Ratio remains above 1, but the relative advantage in achieving profitability is gradually narrowing.
eMerge IS data shows that the overall market MVRV is around 1.51, while the MVRV for LTH and STH is around 1.65 and 1.09 respectively. The MVRV of ultra-short-term holders (holding coins for 1 day to 1 month) is close to 1, reflecting a significant contraction in previously accumulated unrealized profits. The broader short-term MVRV once exceeded 1.2, but subsequently fell back as prices declined.
Long-term holders' SOPR remains around 1.56, while short-term holders' SOPR is close to 1, indicating that recently moved long-term holdings are carrying higher profits on average, while short-term holdings are basically at break-even. Combined with the decrease in LTH supply, the redistribution of profitable holdings is still occurring; however, SOPR measures the profit-to-loss ratio of moved holdings and does not directly measure the size of selling pressure.
In the derivatives market, the overall notional open interest in USD contracts remained largely stable this week. The open interest in Binance BTC/USDT perpetual contracts rose by approximately 1.89% compared to the previous weekend, and the average funding rate also increased. While long positions saw a marginal recovery in funding intentions, this failed to drive a price rebound, indicating that improvements in derivatives are still insufficient to offset supply and demand pressures in the spot market.
Market Implications and Outlook
This week's BTC price movement should be defined as a weak redistribution during a recovery period against the backdrop of macro risk-off, accompanied by phased profit-taking. Compared to the Nasdaq and semiconductor sectors, BTC's decline this week was smaller, indicating that the sell-off did not accelerate significantly, but relative resilience does not equate to independent strength. The market is still digesting long-term profit-taking, and while ETFs have improved, stablecoin supply and exchange inventories have not shown sustained new buying power. Easing selling pressure is a signal of a slowing correction, not a sufficient condition for a trend reversal.
Over the next 1-2 weeks, the baseline scenario remains weak consolidation and market digestion. The $80,000 level is a support level to watch, forming the low point of this round, while the $83,500 level represents short-term resistance corresponding to the 30-day moving average. A more solid foundation for BTC's recovery would be established if macro risk appetite stabilizes, ETFs continue to see net inflows, stablecoin supply resumes expansion, and exchange inventories stop increasing. Conversely, if inflation and AI credit risks continue to suppress risk appetite, and spot buying remains weak, a break below recent lows would require monitoring the short-term holder cost zone around $75,000.
Source:Global Cybersecurity Alliance (GCSA)
Website:www.gcsa.org
Get updates in your inbox
We respect your privacy. See our Privacy Policy